Purpose of this experiment is to demonstrate real time aspect of the web to pull data from an Arduino.
Arduino can be clubbed together with several sensor to receive data of surroundings and do anything with data. Once you have data with you, imagination is the limit like sending surrounding temperature to Twitter as tweet, check mail when you come close to your computer, turn off volume when an ad comes on TV etc.
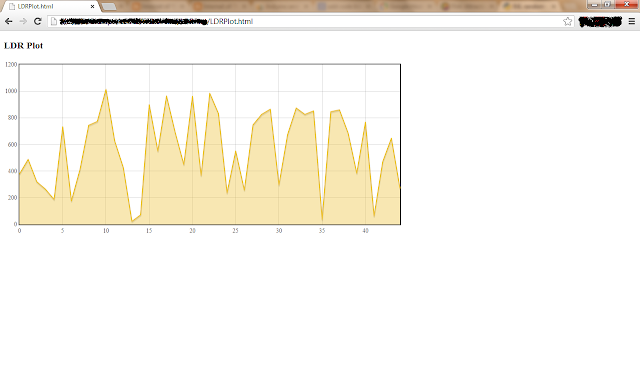
Following POC shows use of Arduino with LDR sensor to plot real time graph of Light around you.
You will need following things for our project :
- Arduino UNO or Freeduino
- LDR or photo-resistor
- 10k ohm resistor (Voltage divider)
- Computer
Let connect things
Connect your LDR and resistor as shown in figure.,
Now coding part,
The idea here is to read sensor reading using Arduino and send them to computer for further processing, so we will read sensor data and send it serial port of computer where Arduino is connected.
filename: LDR.ino
int LDR = 0;
void setup(){
Serial.begin(9600);
}
void loop(){
int Reading = analogRead(LDR);
Serial.println(Reading);
delay(250);
}
Code is pretty self-explanatory. Now the web part here we will use websocket for reading values and plotting real time graph out of read values. We will not discuss websocket and its implementation as this is out of scope of this project (which itself is big topic for discussion).
In order to run the code you need to install Python with following modules
- geventwebsocket.handler
- gevent
- serial
Here websocket server written in Python,
filename: LDRreader.py
from geventwebsocket.handler import WebSocketHandler
from gevent import pywsgi
import gevent
import serial
# PORT used for websocket client
PORT = 8090
import os
import random
def handle(ws):
""" This is the websocket handler function. Note that we
can dispatch based on path in here, too."""
serial_read = serial.Serial('COM31', 9600)
if ws.path == '/data':
for i in xrange(10000):
signal = serial_read.readline()
ws.send("0 %s %s\n" % (i, signal))
print "0 %s %s\n" % (i, signal)
gevent.sleep(0.1)
def app(environ, start_response):
if environ['PATH_INFO'] == '/test':
start_response("200 OK", [('Content-Type', 'text/plain')])
return ["blah blah"]
elif environ['PATH_INFO'] in ("/data"):
handle(environ['wsgi.websocket'])
else:
start_response("404 Not Found", [])
return []
def main():
print "In main, Starting WSGIServer"
server = pywsgi.WSGIServer(('0.0.0.0', PORT), app,
handler_class=WebSocketHandler)
try:
server.serve_forever()
except:
pass
if __name__ == "__main__":
main()
Now websocket client which will actual receive data and plot it on web browser, you need this library for plotting graph. Download and keep in same directory where LDR.html is present.
filename: LDR.html
<!DOCTYPE html>
<html>
<head>
<script src="//ajax.googleapis.com/ajax/libs/jquery/1.10.1/jquery.min.js"></script>
<script src="jquery.flot.js"></script>
<script>
var iets = "";
window.onload = function() {
var data = {};
try {
var s = new WebSocket("ws://localhost:8090/data");
}
catch (e) {
var s = new MozWebSocket("ws://localhost:8090/data");
}
s.onopen = function() {
console.log('Websocket Open');
s.send('hi');
};
s.onmessage = function(e) {
console.log('got ' + e.data);
var lines = e.data.split('\n');
for (var i = 0; i < lines.length - 1; i++) {
var parts = lines[i].split(' ');
var d = parts[0], x = parseFloat(parts[1]), y = parseFloat(parts[2]);
if (!(d in data)) data[d] = [];
data[d].push([x,y]);
}
var plots = [];
for (var d in data) plots.push( { data: data[d].slice(data[d].length - 200) } );
$.plot( $("#holder"), plots,
{
series: {
lines: { show: true, fill: true },
},
yaxis: { min: 0 },
} );
s.send('');
};
};
</script>
</head>
<body>
<h3>LDR Plot</h3>
<div id="holder" style="width:800px;height:350px"></div>
</body>
</html>
Now start our websocket server using
# python LDRreader.py
now go to browser and type http://localhost:8090 and bam !!!
You will see plotting graph.

